May. 19, 2020
Knowledge Graph part 1 – Using AI insights to connect the dots and make better business decisions.
By Szymon Klarman @BlackSwan Technologies
The need for actionable data
We live in an era of data: generated by IoT, IIoT, Social media, and business applications (#BI). But still, most large organizations act upon a very small percentage of the data they possess because of data fragmentation, overlap, inconsistent formats and disparate holding systems. Organizations are often forced to make decisions based on contradicting or incomplete information. It is simply impossible or too time-consuming to comb through all the relevant information when a decision is needed.
Introducing the Knowledge Graph
Knowledge graph technology helps by processing massive amounts of data in a similar way to the human mind. The technology focuses on specific objects described by data, uncovers non-obvious relationships between them and uses that knowledge to categorize and organize the data. Machine learning (#ML) is used to continuously update the graph and create new knowledge about the objects and their relationships. In response to a query, knowledge graphs can present all relevant pieces of information in one consistent conceptual map; helping decision-makers to gain insights of unprecedented granularity, depth, and precision. A proper overview of all data and relationships between them is especially vital when the decision is within the realm of safety, due diligence, or compliance.
But can you access this data directly in the knowledge graph and interpret them? When dealing with small data sets, the answer is yes. When approaching large data sets, it becomes more difficult. The good news is that this representation of data is easy to read for machines, which can further aid in the decision process by applying machine intelligence.
Without the use of a knowledge graph, sourcing, linking, and cleansing all the source data would need to be done manually or by custom-designed software code. Such a traditional approach of data preparation takes up to 80% of the whole data science and analysis process.
Knowledge Graph use cases
Google Web Search is a popular example of using a knowledge graph to gather general world information spread across millions of websites.
Similarly, for the modern enterprise, a knowledge graph can be used to process data about products, services, and clients (@eBay, @Facebook, @Netflix do that), even when data is spread over different databases, spreadsheets and documents in disconnected systems. It can also be used in the clinical environment to address the ever-present challenge of gaining a complete view of a patients’ data (e.g. health history and clinical treatment records) and combining that with current medical knowledge about human health, diagnostic and treatment methodologies.
Companies or communities that have access to a knowledge graph covering their domain of interest possess a clear advantage in decision making they can base decisions on readily available and comprehensive data. Some good examples of publicly available knowledge graphs include UniPort (aggregating vast knowledge about proteins and their functions) or PermID (focused on linking organizations, their top managing officers, and diverse corporate actions). In the second part of this series, we will focus on more examples of knowledge graph applications and benefits that they bring.
Knowledge Graph in details
Let us go one step further and use a specific example to show how the knowledge graph technology works and why it is highly useful for the above tasks. For instance, if we type the string “Alexander Fleming” into Google’s search box, we don’t just get a set of documents containing this phrase, but also an Infobox with data about a specific entity, namely, a UK Biologist, Alexander Fleming, who matches the query.
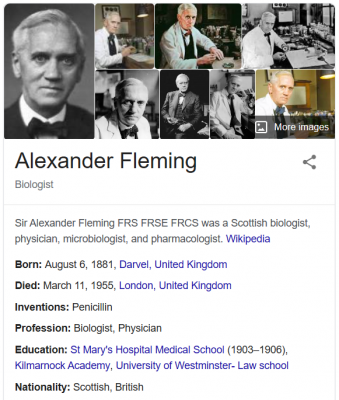
There, among other information, we can find out that Alexander Fleming invented Penicillin and that he was born in Darvel, on Aug 6, 1881. Under the surface, this data corresponds to a small fragment of a knowledge graph that could be simply depicted as:
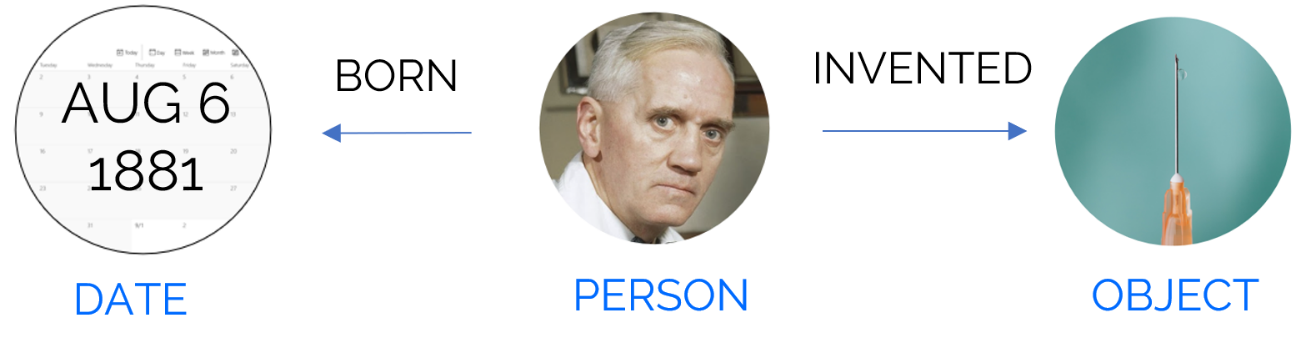
The nodes of this graph represent real-world things or concepts, while the edges – their properties or relations holding between them. The labels on all the elements are what makes the semantics, i.e. the meaning of the whole structure, explicit. No website on the Internet might contain all these facts in the same place, yet Google Knowledge Graph views them as connected pieces of the same conceptual map, which they indeed are. This “networked” representation of data is not only more intuitive, but importantly, it makes the existing relationships between entities in the given domain transparent. This enables to put all things in their full information context, easy to comprehend and access.
For instance, we can try searching again for “When was the birthdate of inventor of penicillin” and immediately get the correct date of August 6, 1881. Remarkably, this response is the result of traversing the underlying graph the way a human with the same knowledge would: starting from the named object, via the link to a person, and finally to the date of birth. This vital feature of connecting data and uncovering non-obvious and indirect relationships is one of the main benefits of using a knowledge graph.
Knowledge Graph and AI
We said that knowledge graph technology relates to and contributes to Machine Learning. The recent boom of interest in knowledge graphs comes from the realization that an intelligent system needs to be able to acquire novel insights from new and existing data. Still, its effectiveness depends critically on how well it can understand, access, and combine all that data in the learning process. The power of the knowledge graph comes from exposing all objects described in data and uncovering non-obvious and indirect relationships between them.
The above points us to the origin of the knowledge graph technology – decades of research in Artificial Intelligence (#AI) as a paradigm of managing large volumes of complex, highly interconnected data, in a way that makes its meaning understandable to machines. AI has always comprised two adjacent and complementary areas: the symbolic AI, focused on the problem of exploiting knowledge in the form of logical facts and rules, and statistical AI, developing statistical methods for discovering correlation patterns in data. Knowledge graphs originate from the former, while machine learning from the latter, but it is only when the two are combined that the maximum intelligence can be achieved. In practice, it may mean finding new applications of an existing drug, prospective customers for a product, or unexpected risk in planned transactions.
Read the next part of this series to learn more about real-life applications of knowledge graphs, their technical aspects, and practical benefits.
 Szymon Klarman is a Knowledge Architect at BlackSwan Technologies. He holds a PhD in knowledge representation and reasoning and has over 10 years of experience working in the field as an R&D specialist, consultant, and an academic researcher.